Non linear regression is a tool to find parameter from decline curves models, In this example we show you how use curve_fit() function from scipy package in python. First loading the data and plot to analize its behavior
import pandas as pd

data = pd.read_csv('REH_18.csv')
data
DAYS RATE
0 1 2.30000
1 2 3.00000
2 3 3.20000
3 4 3.00000
4 5 3.20000
.. ... ...
475 476 0.76237
476 477 0.66001
477 478 0.23185
478 479 0.26329
479 480 0.50926
[480 rows x 2 columns]import matplotlib.pyplot as plt
DAYS = data.iloc[:, 0].values
RATE = data.iloc[:, 1].values
plt.scatter(DAYS,RATE);
plt.xlabel('Days');
plt.ylabel('Qg');
plt.show();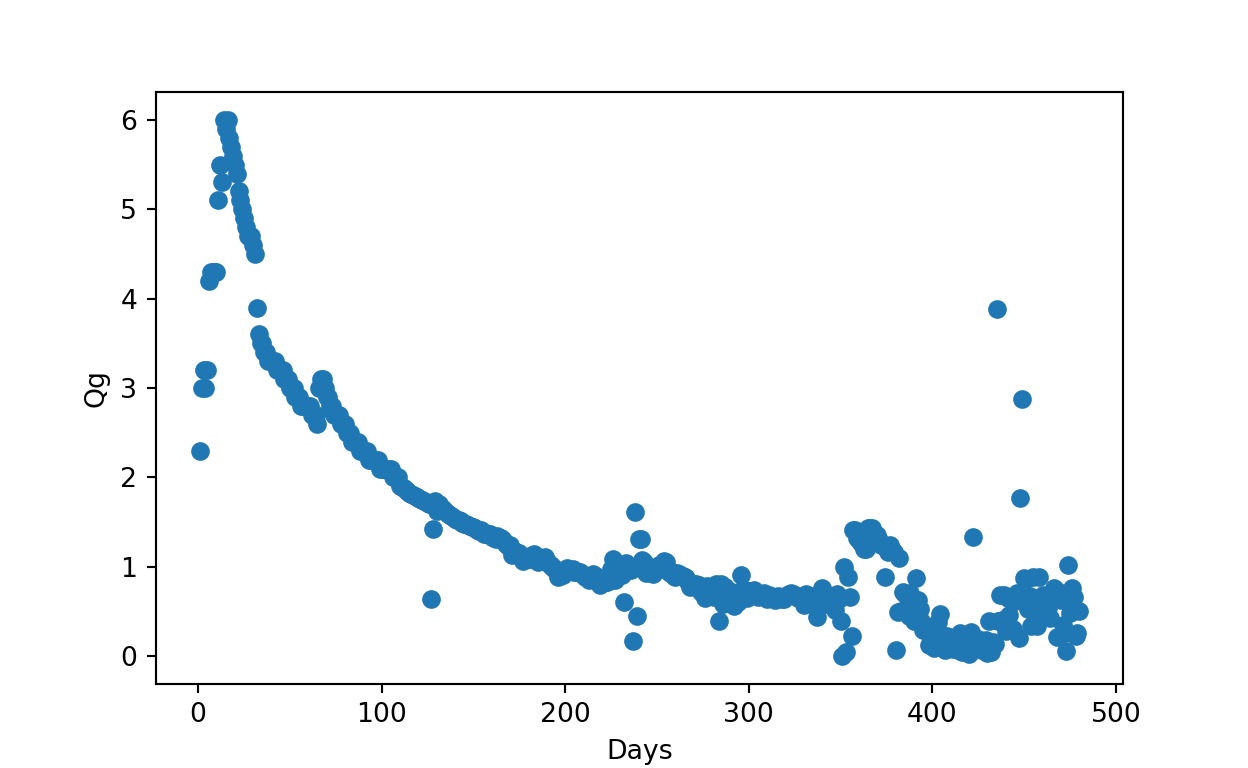
Hyperbolic decline
\[q_t=\frac{q_i}{(1+bD_it)^{1/b}}\]
Fist, the equation to fit the data has to be defined as a python function. The parameter getting from fitting are the equation coefficiente and the coefficiente with a confidence interval.
from scipy.optimize import curve_fit

def hyperbolic(t,qi,b,Di):
    return qi/((1+b*Di*t)**(1/b))

coef, coef_ic = curve_fit(hyperbolic, DAYS, RATE);
C:/Python37/python.exe:2: RuntimeWarning: invalid value encountered in powerprint(coef)[5.22129555 0.50293836 0.01120251]print(coef_ic)[[1.63858719e-02 5.22214531e-03 9.03298155e-05]
[5.22214531e-03 4.35482279e-03 5.10036457e-05]
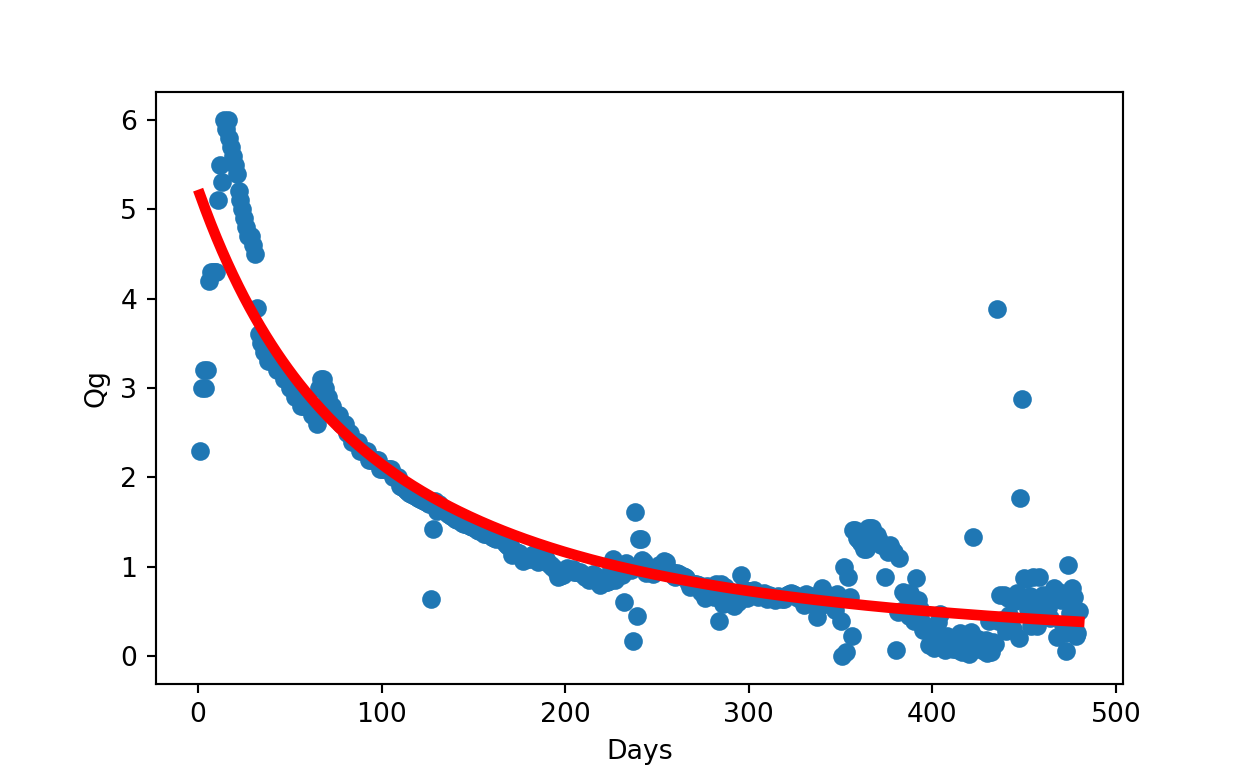
[9.03298155e-05 5.10036457e-05 7.27271243e-07]]Now, the predicted prodcution rate can be calculate using fitting parameters
hyp_pred = hyperbolic(DAYS, coef[0], coef[1], coef[2])

plt.rcParams["figure.figsize"]=20,10;
plt.scatter(DAYS, RATE);
plt.plot(DAYS,hyp_pred, color = "red", linewidth = 4);
plt.xlabel("Days");
plt.ylabel("Qg");
plt.show("");