We want to share some excel spreadsheets about basic reservoir simulation and waterflooding based on Abou-Kassem et. al. (2006) and Willhite (1986)
ARS (Cartesian)
ARS is a basic reservoir simulation spreadsheet. With ARS you can do examples considering the follow features:
-One dimension
-One phase (oil)
-Incompressible or Slightly compressible fluid
-Rock porosity constant or depending of pressure
-5 different types of boundary conditions
-One well (specified production rate or specified flowing pressure)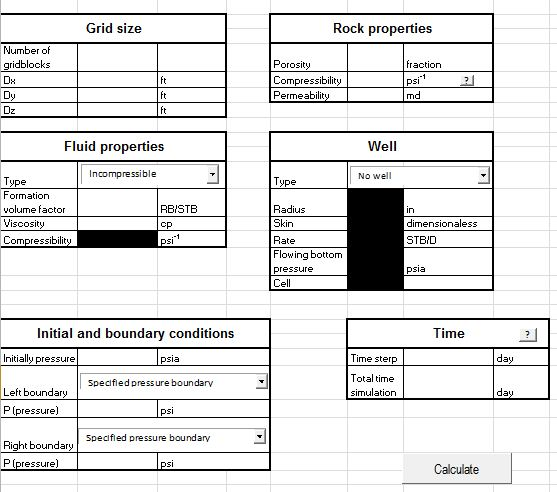
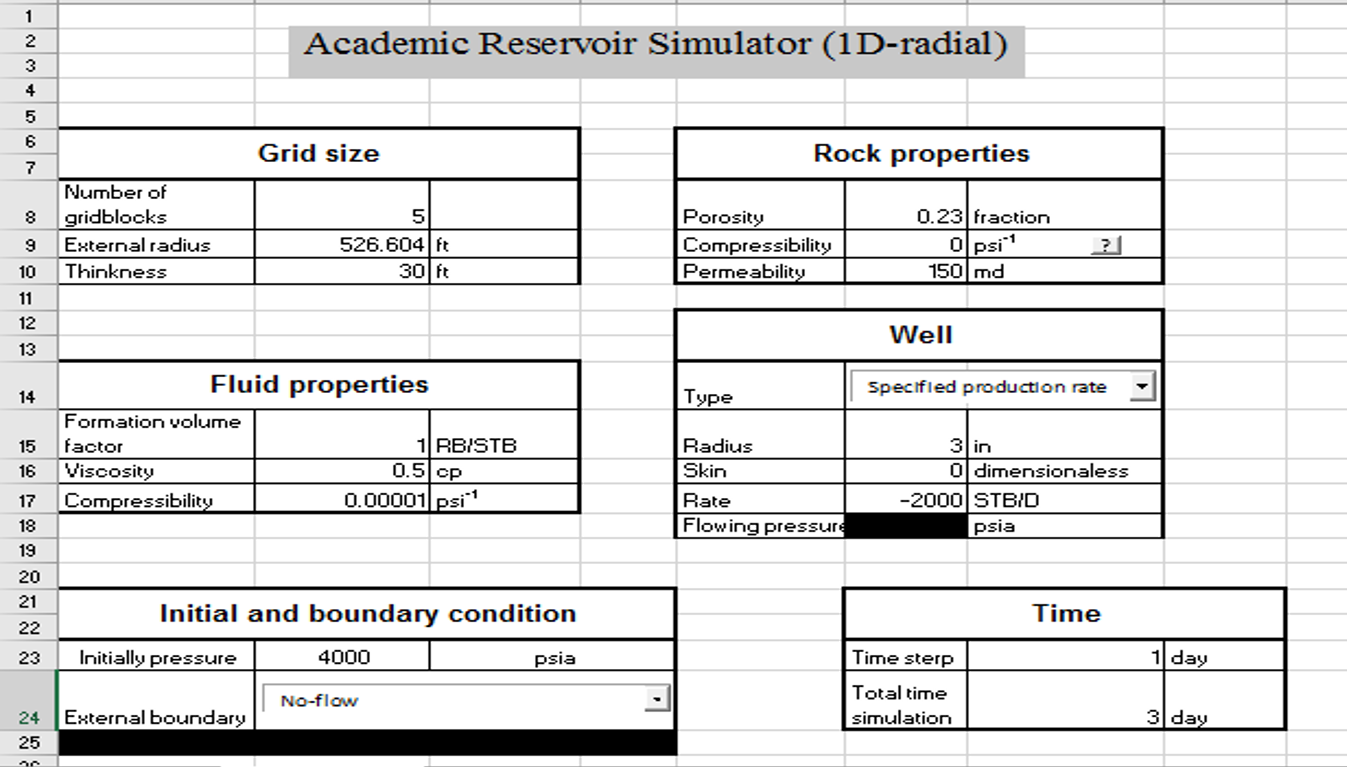
Academic Reservoir Simulator (1D - radial)
With ARS (1D - radial) you can do examples considering the follow features:
-One dimension in radial coordinates -One phase (oil) -Slightly compressible fluid -Rock porosity constant or depending of pressure -4 different types of boundary conditions -Well with specified production rate or specified flowing pressure)
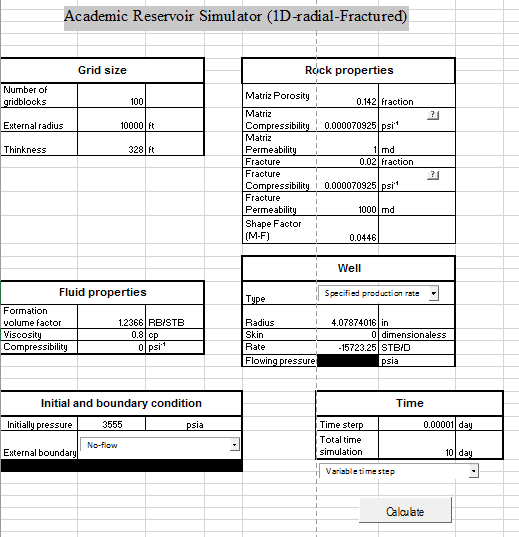
 ARS (1D - radial-Fractured)
ARS (1D - radial-Fractured) is part of a serie of basic reservoir simulation spreadsheets. With ARS (1D - radial-Fractured) you can do examples considering the follow features:
Naturally fractured reservoir (Warren and Root model) One dimension in radial coordinates One phase (oil) Slightly compressible fluid Rock porosity depending of pressure 4 different types of boundary conditions Well with specified production rate or specified flowing pressure)
You will need the petrophysics properties of matrix and fracture (Porosity, compressibility, permeability and matrix-fracture shape fracture). You have the option to use a constant or variable time step.
In the follow image you can observe the double slope expected from the Warren and Root model.
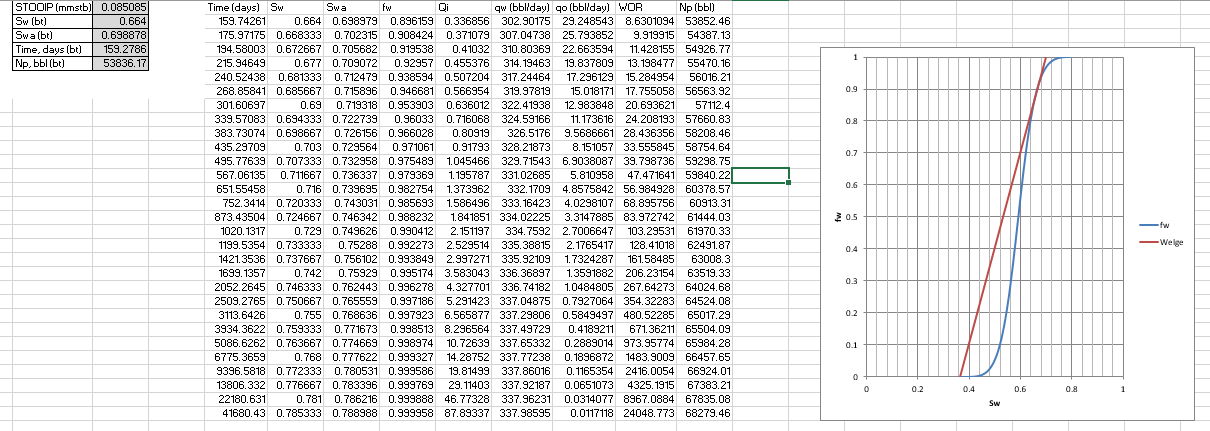
 Academic WaterFlooding (AWF)
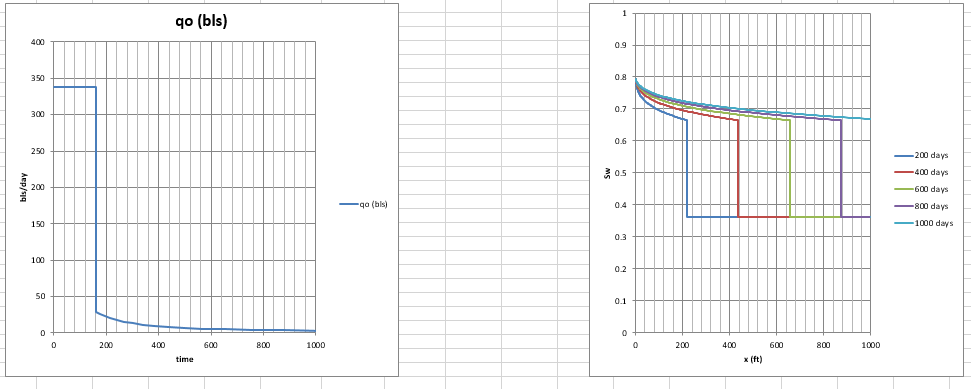
AWF is part of a serie of basic reservoir engineering spreadsheets. With AWD you can do examples using thw Buckley-Leverett model and Welge solution estimating the displacement performance for a linear waterflood at constant injection rate.The necessary data is shown in the next picture.
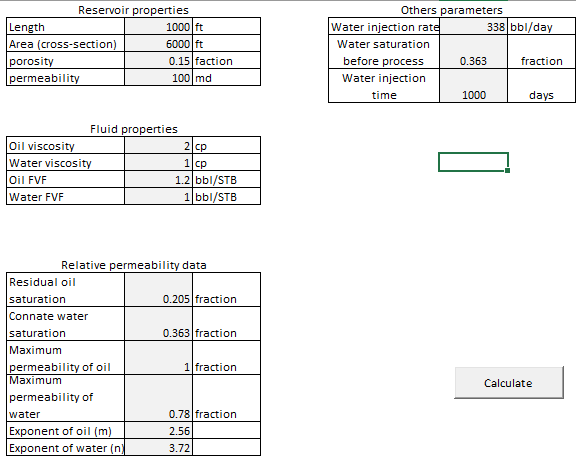
AWF calculates the Sw at breakthrough and generates three differents charts:
-Sw vs fw -time vs Qo -x vs Sw
Also it calculates Np, WOR and Qo at differents times. Download it and tell us what you think.
References
Abou-Kassen, J.H.; Farouq, S. M. and Rafiq, M (2006) Petroleum reservoir simulation A basic approach. Willhite, G. P. (1986) Waterflooding